Projects
Real-world data analysis & interactive dashboards
A collection of analytics projects focused on turning data into clear insights.
Latest Projects
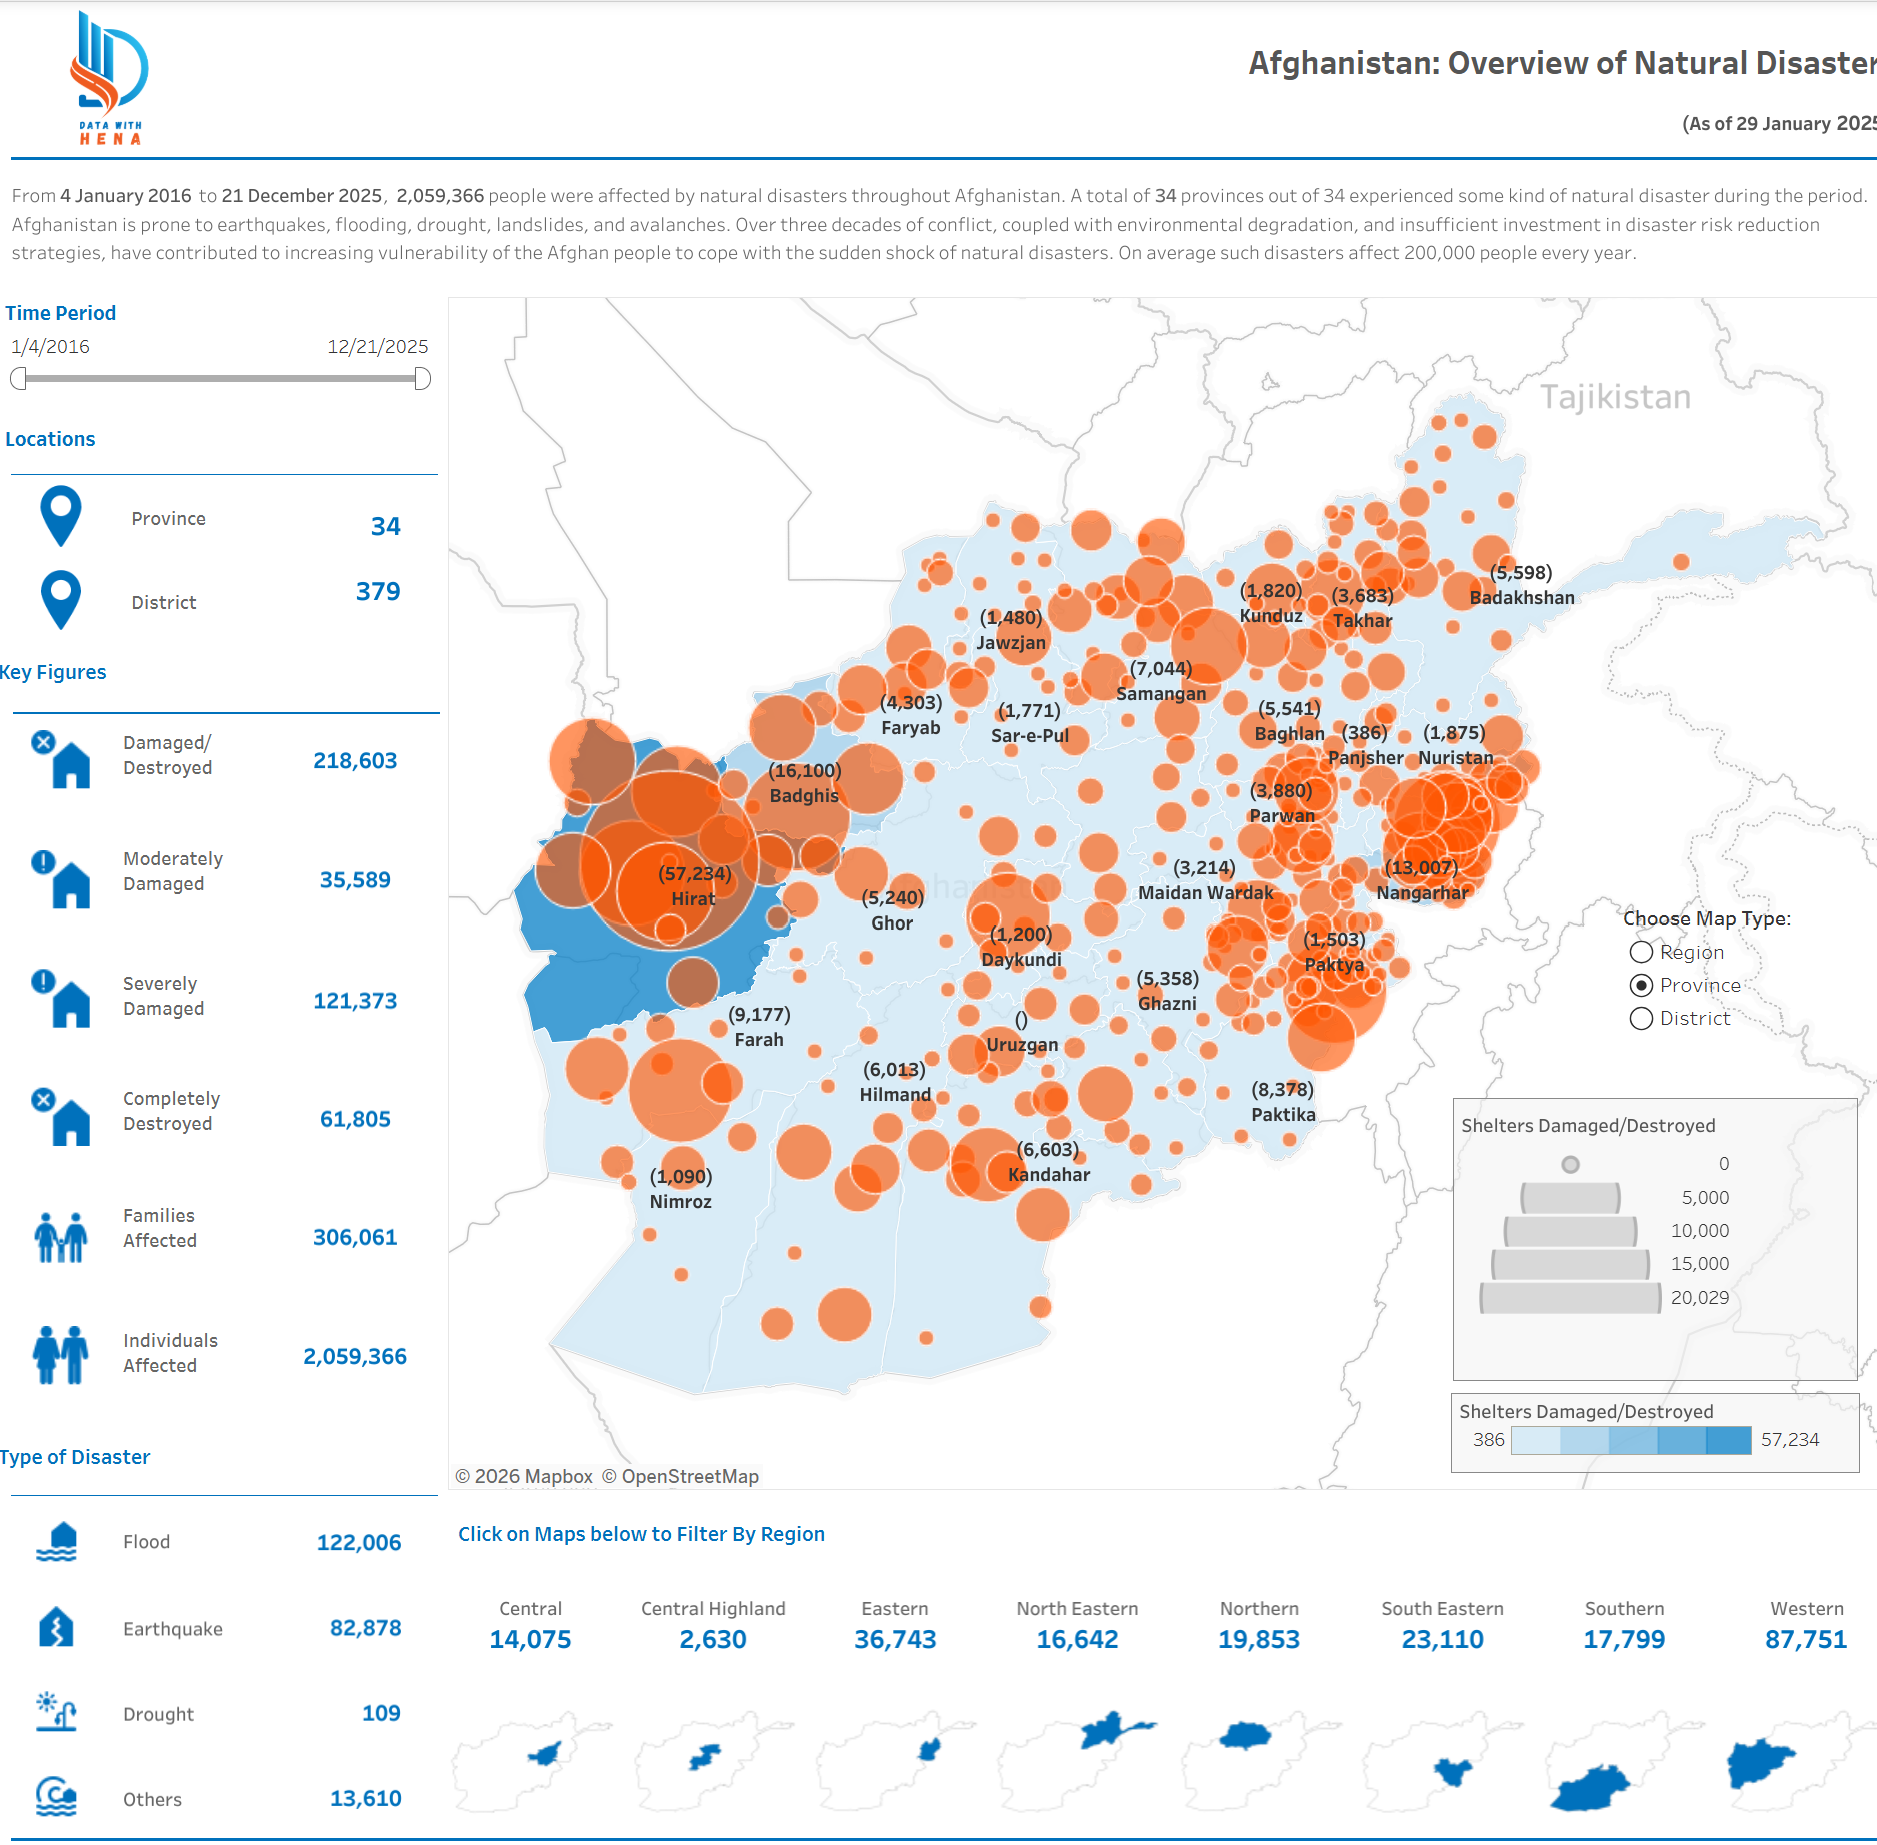
Afghanistan Natural Disasters Dashboard
Problem: Stakeholders needed a clear view of disaster patterns across Afghanistan for planning and response.
Tools: Tableau.
What I did: Built an interactive geographic dashboard with filters by disaster type, location, and time.
Key result: The dashboard highlights high-risk regions and recurring disaster trends at a glance.
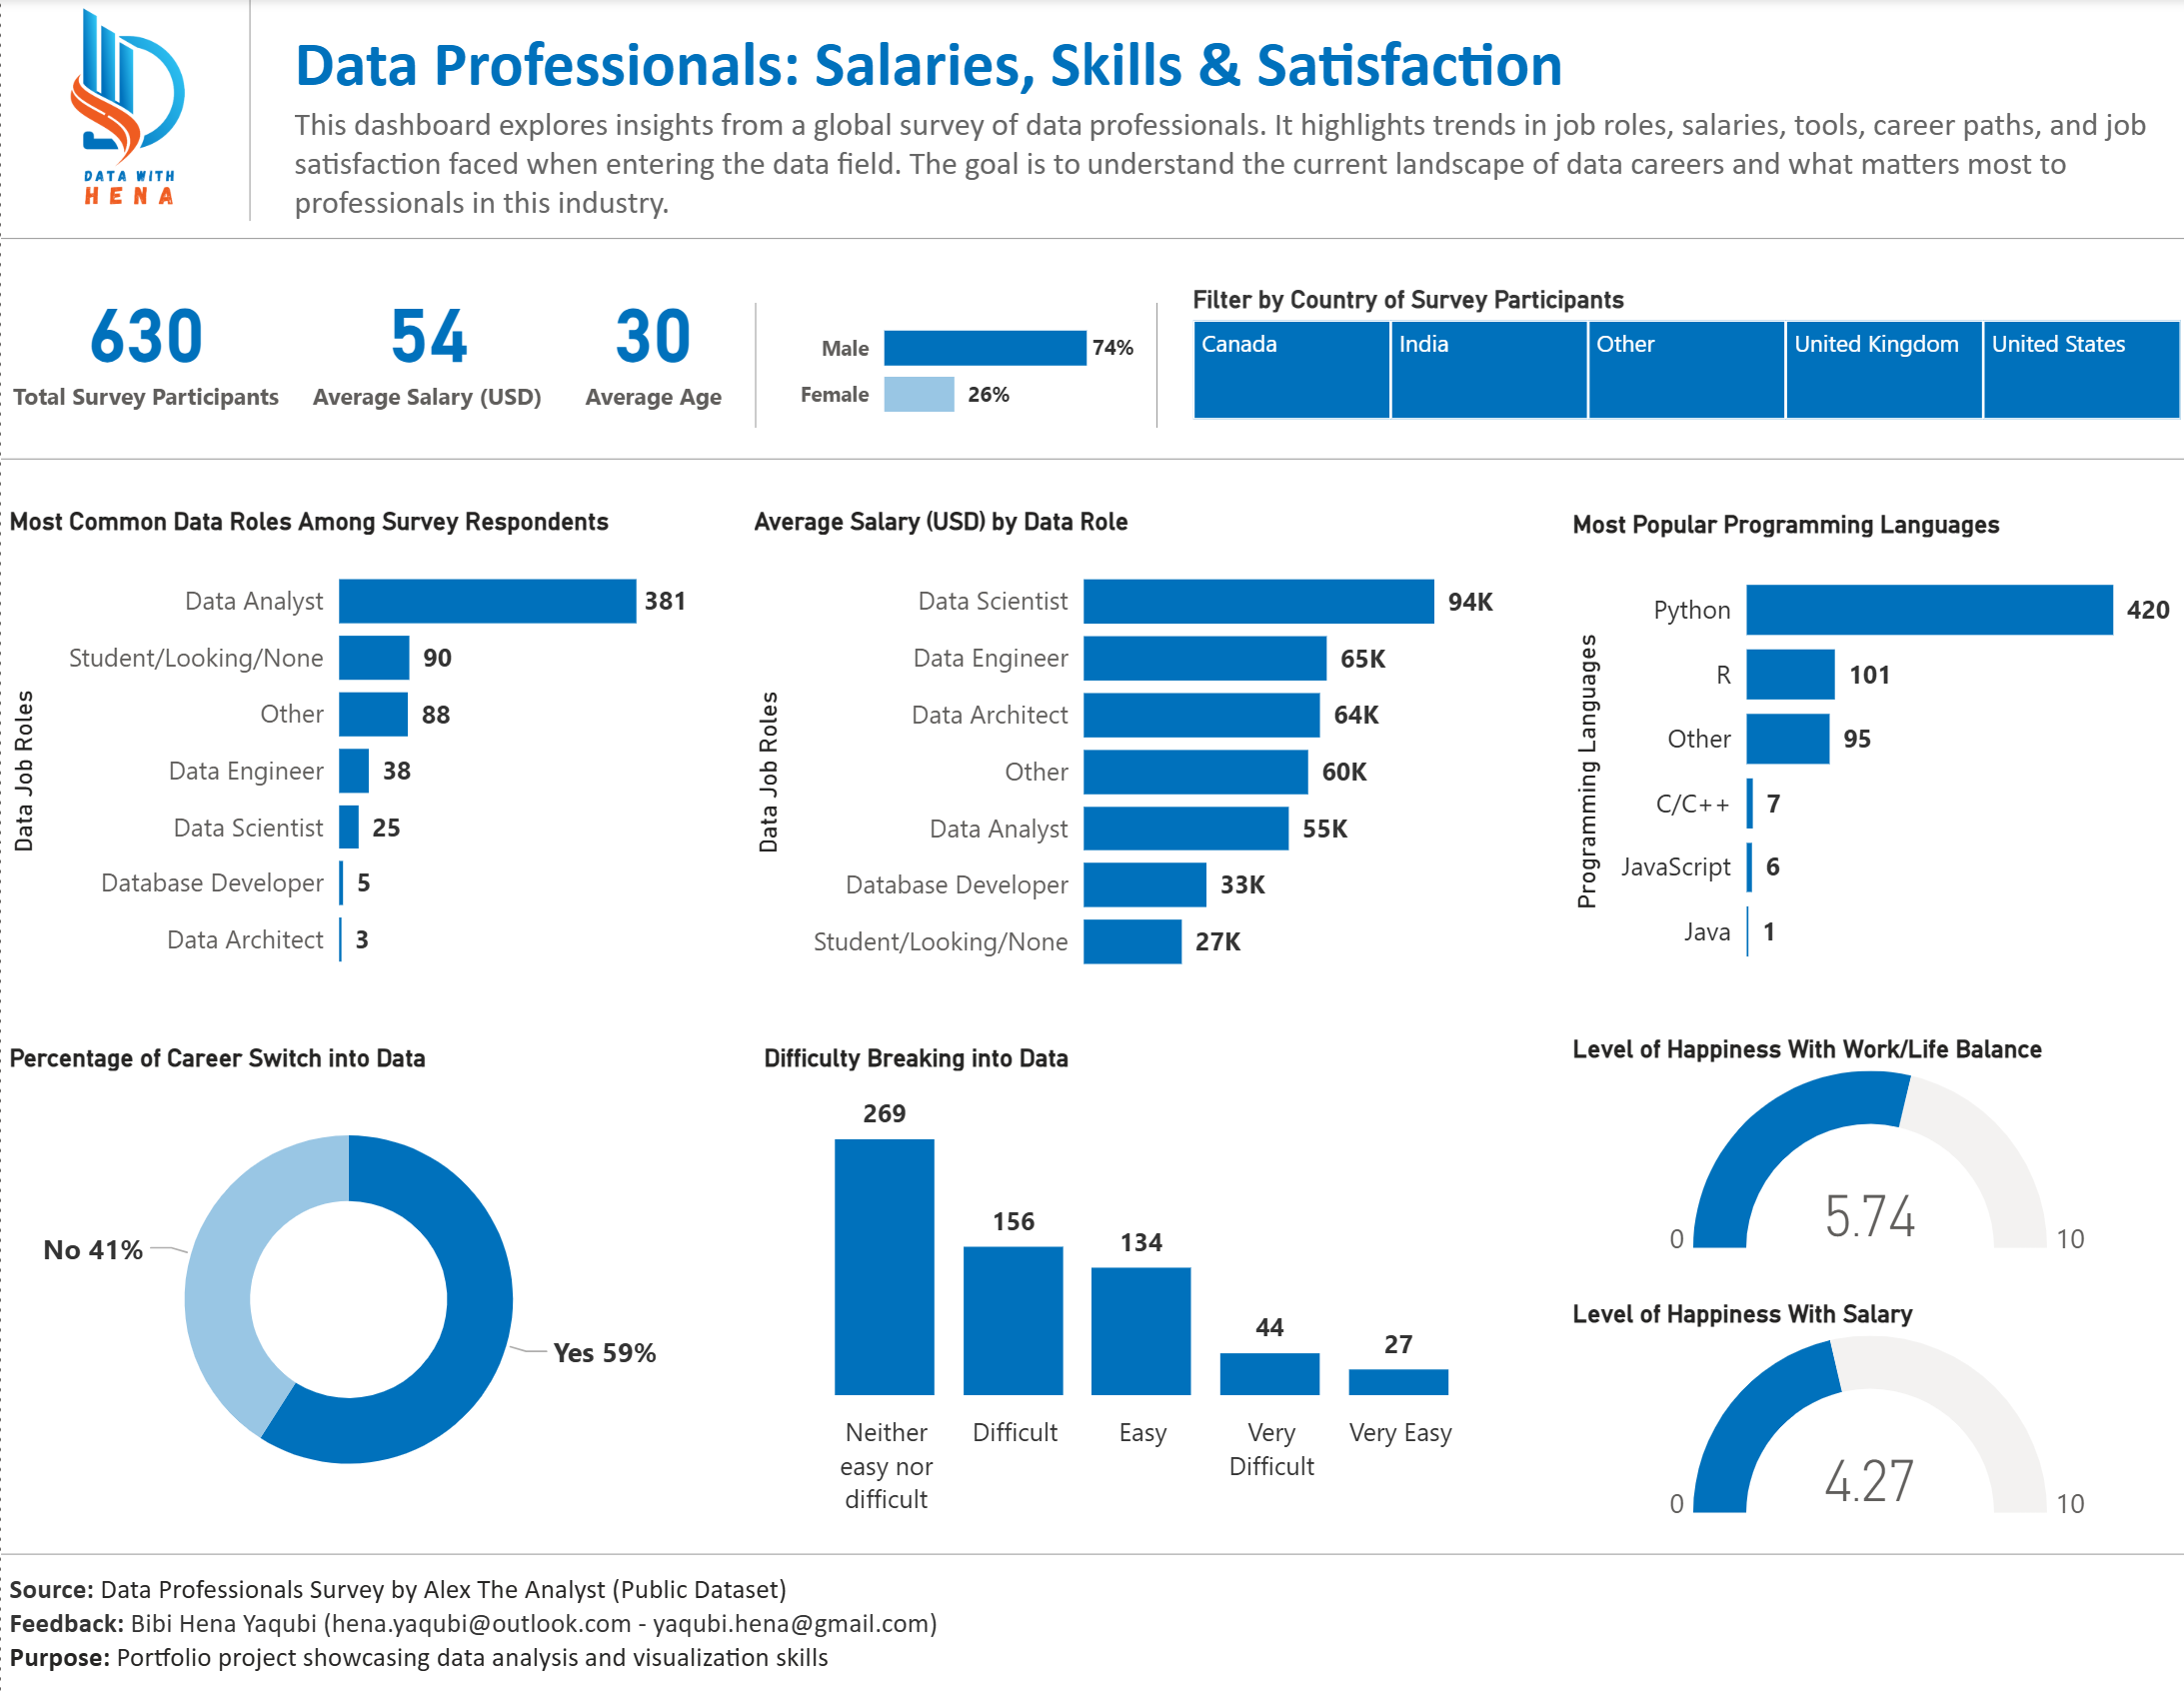
Data Professionals Survey Dashboard
Problem: Data professionals needed clearer insight into career trends, salary, and skills demand.
Tools: Power BI.
What I did: Built a survey dashboard covering roles, salaries, programming languages, and job satisfaction.
Key result: The report surfaces clear patterns in compensation and role-specific skill preferences.
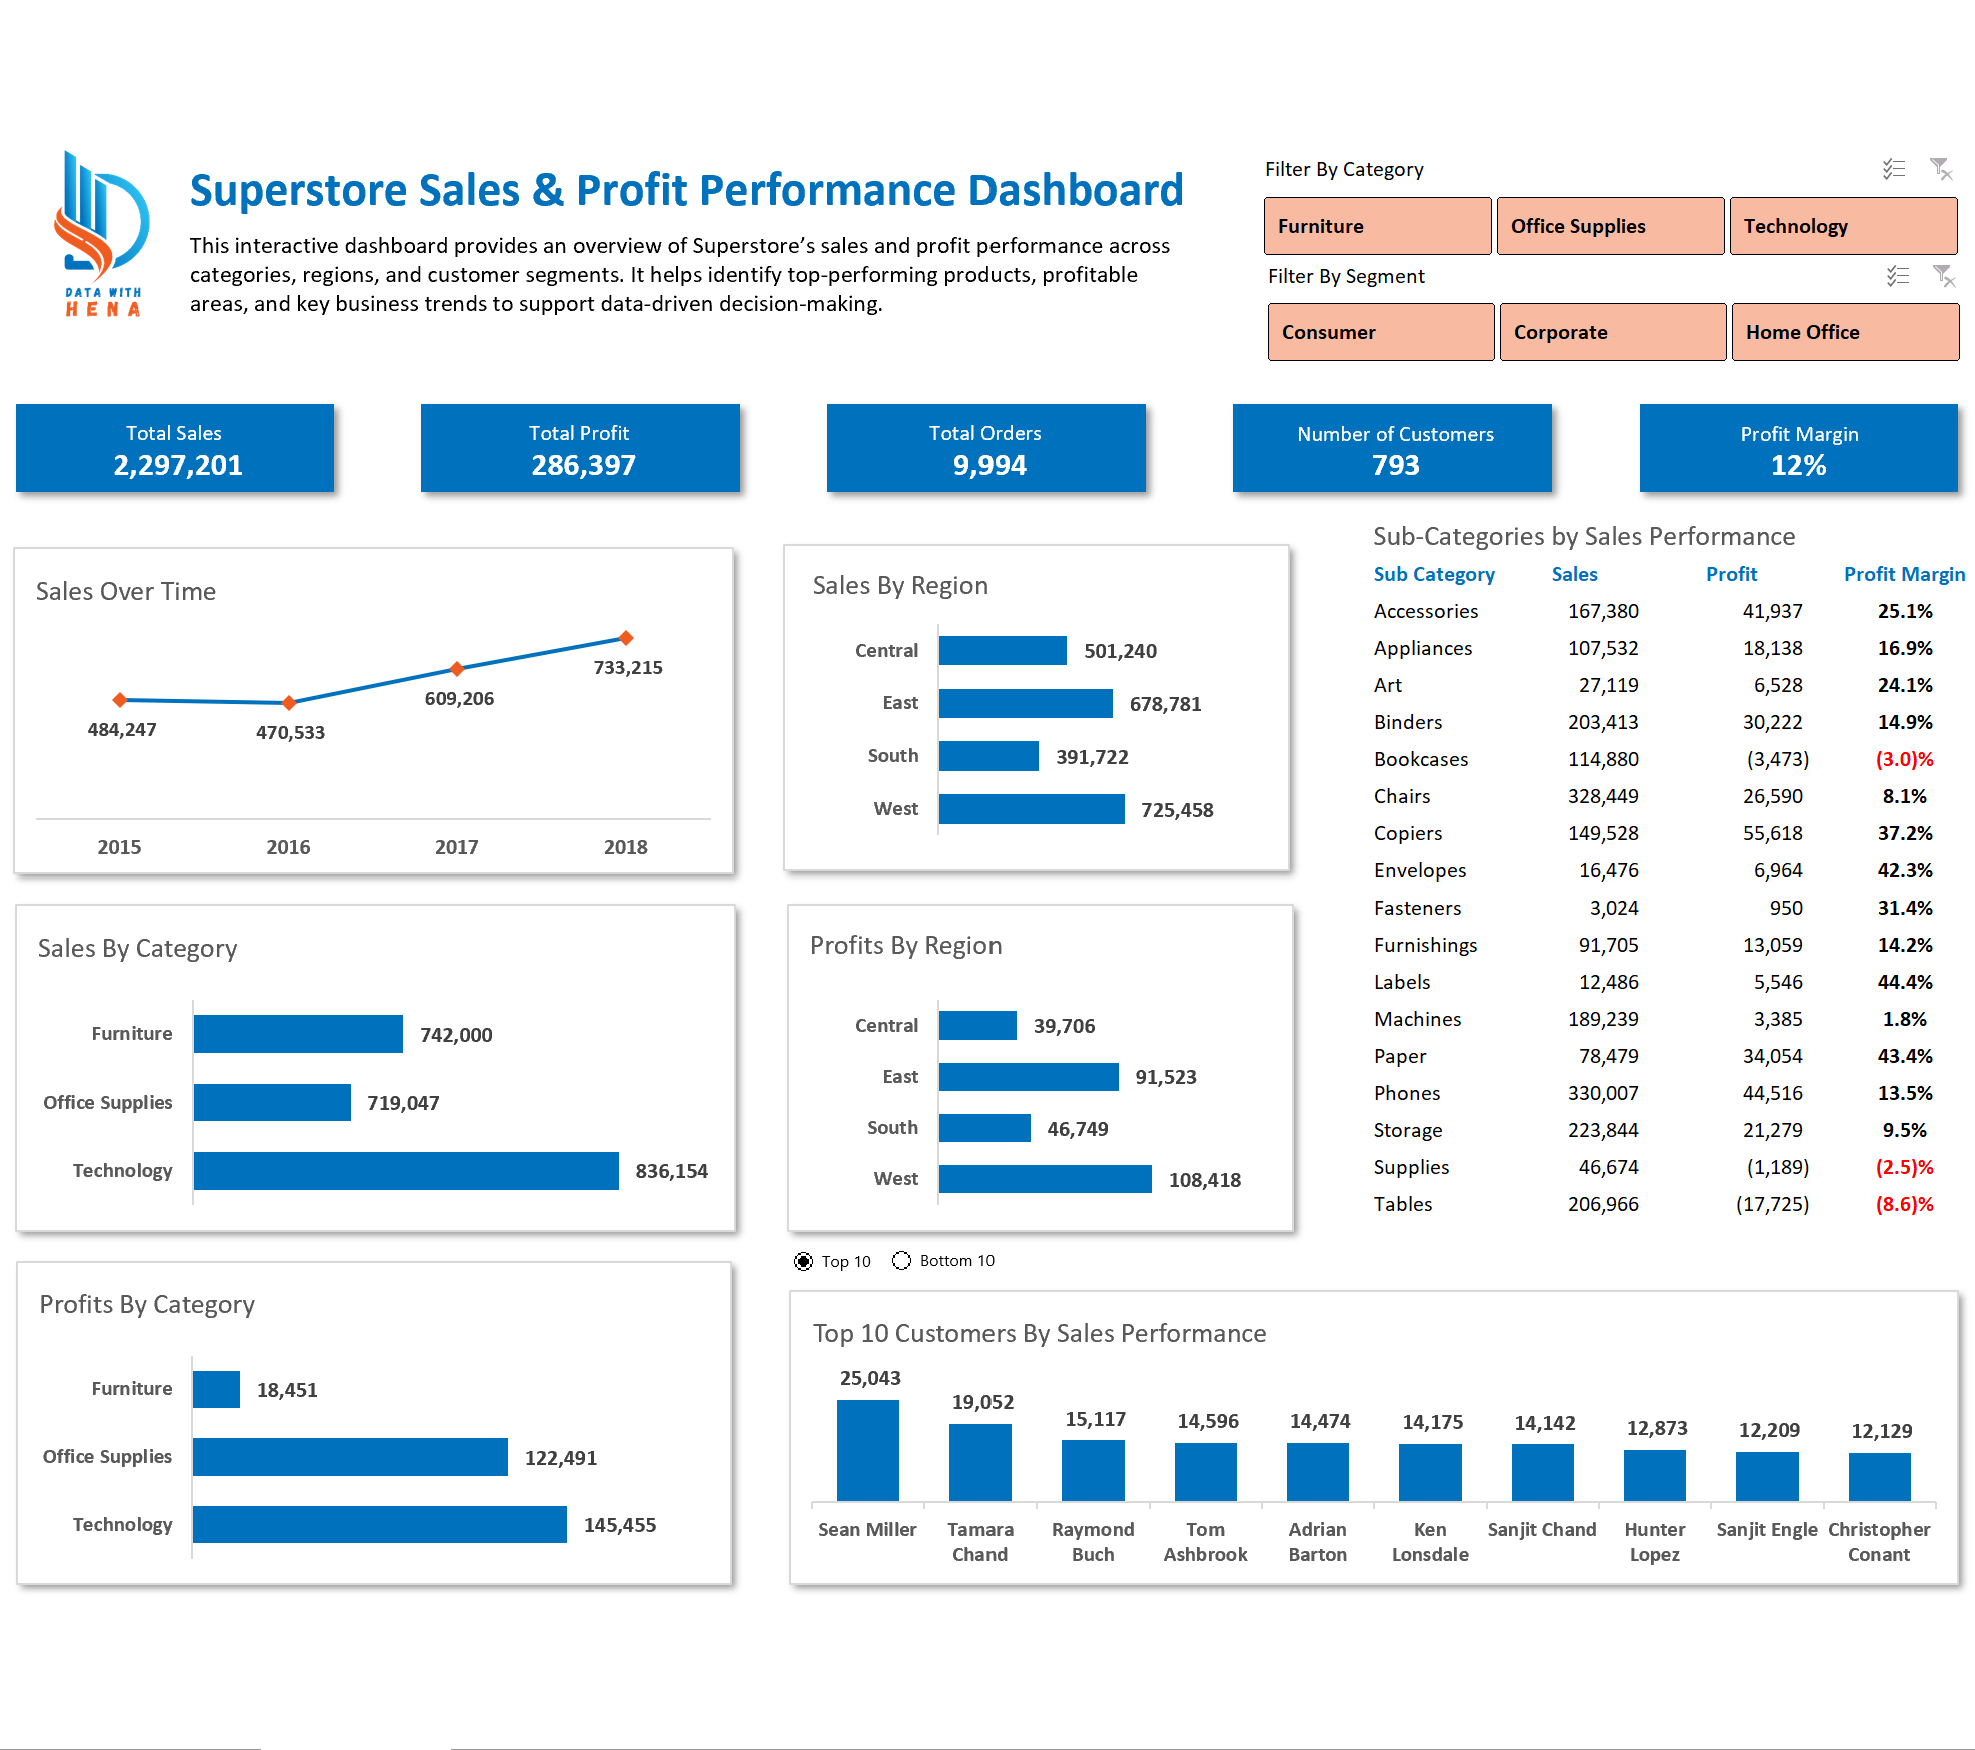
Superstore Sales & Profit Performance Dashboard
Problem: Business performance data was hard to track across categories, regions, and customer segments.
Tools: Microsoft Excel.
What I did: Designed an interactive dashboard for sales, profit, and trend analysis using structured visuals.
Key result: The dashboard quickly reveals top and low-performing areas for decision-making.
Global Happiness Trends Project
Problem: Global happiness drivers needed to be explained in a clear, evidence-based way.
Tools: Python, Kaggle, Tableau.
What I did: Analyzed World Happiness Report data, then translated findings into an interactive dashboard.
Key result: Key socio-economic factors and country-level patterns become easy to compare over time.
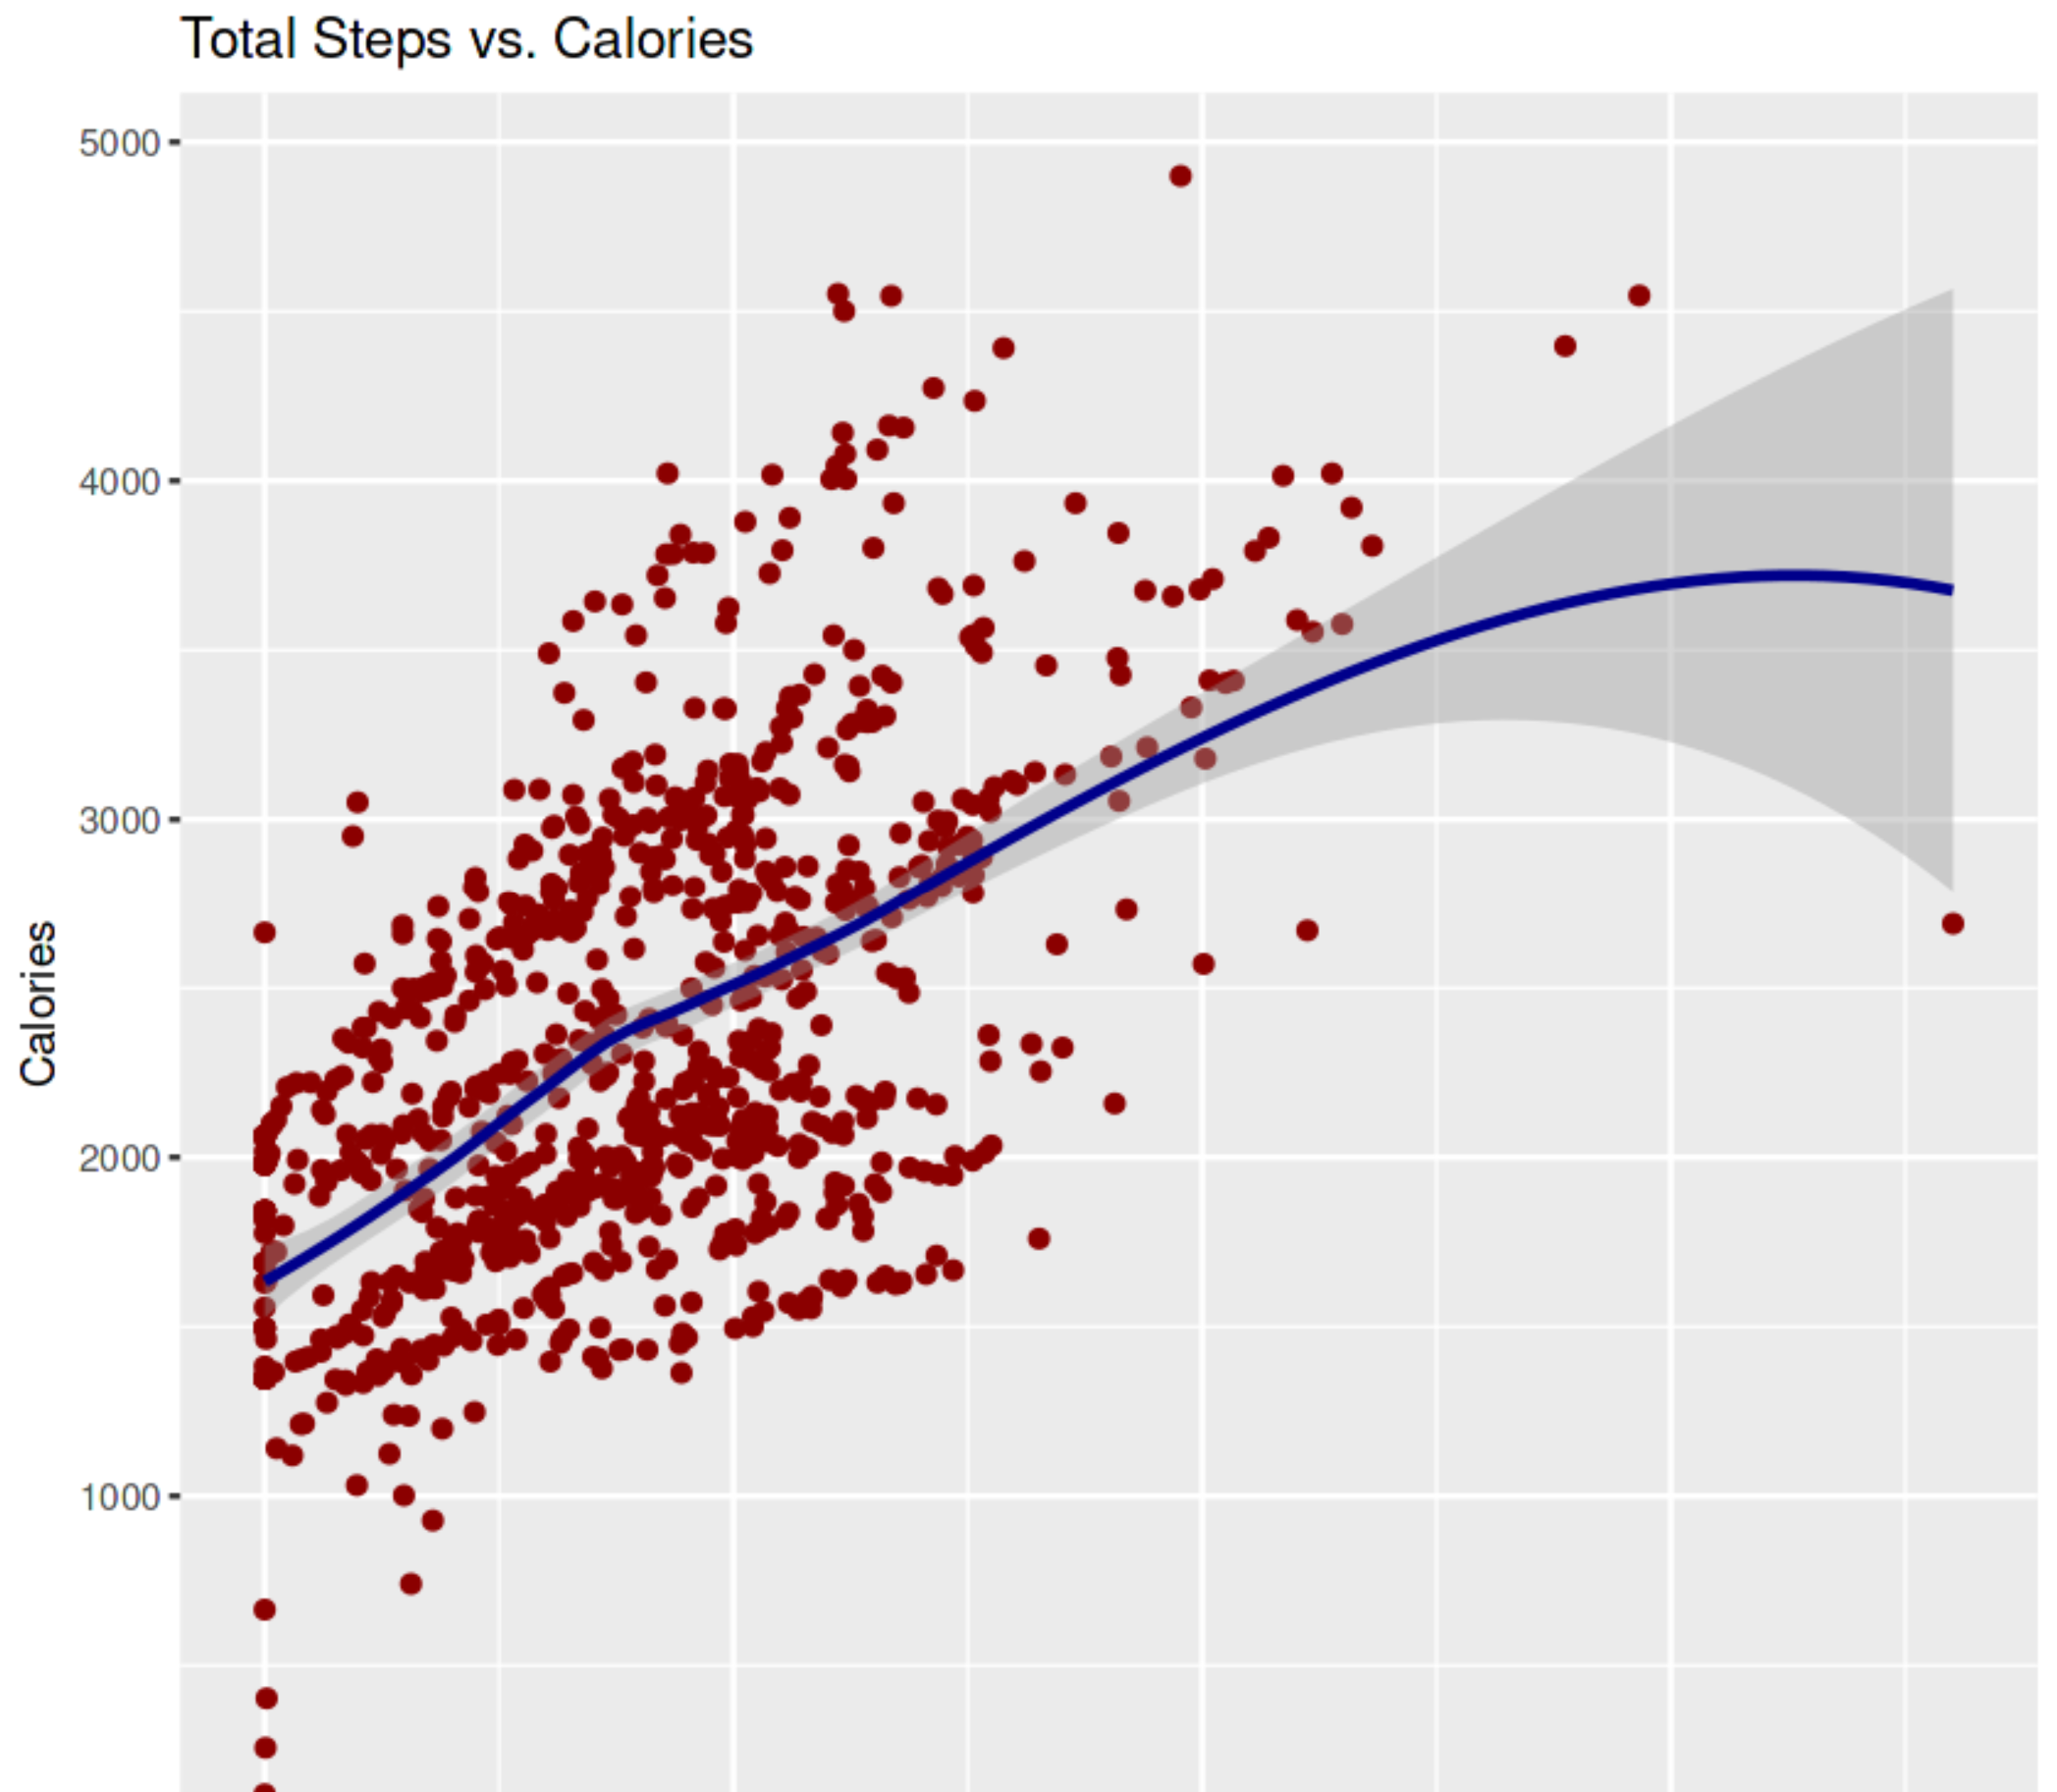
Bellabeat Case Study
Problem: Bellabeat needed data-backed guidance on user behavior in fitness tracking products.
Tools: R, Kaggle.
What I did: Cleaned and analyzed activity and sleep data to identify usage patterns and opportunities.
Key result: Insights supported actionable recommendations for product and marketing strategy.
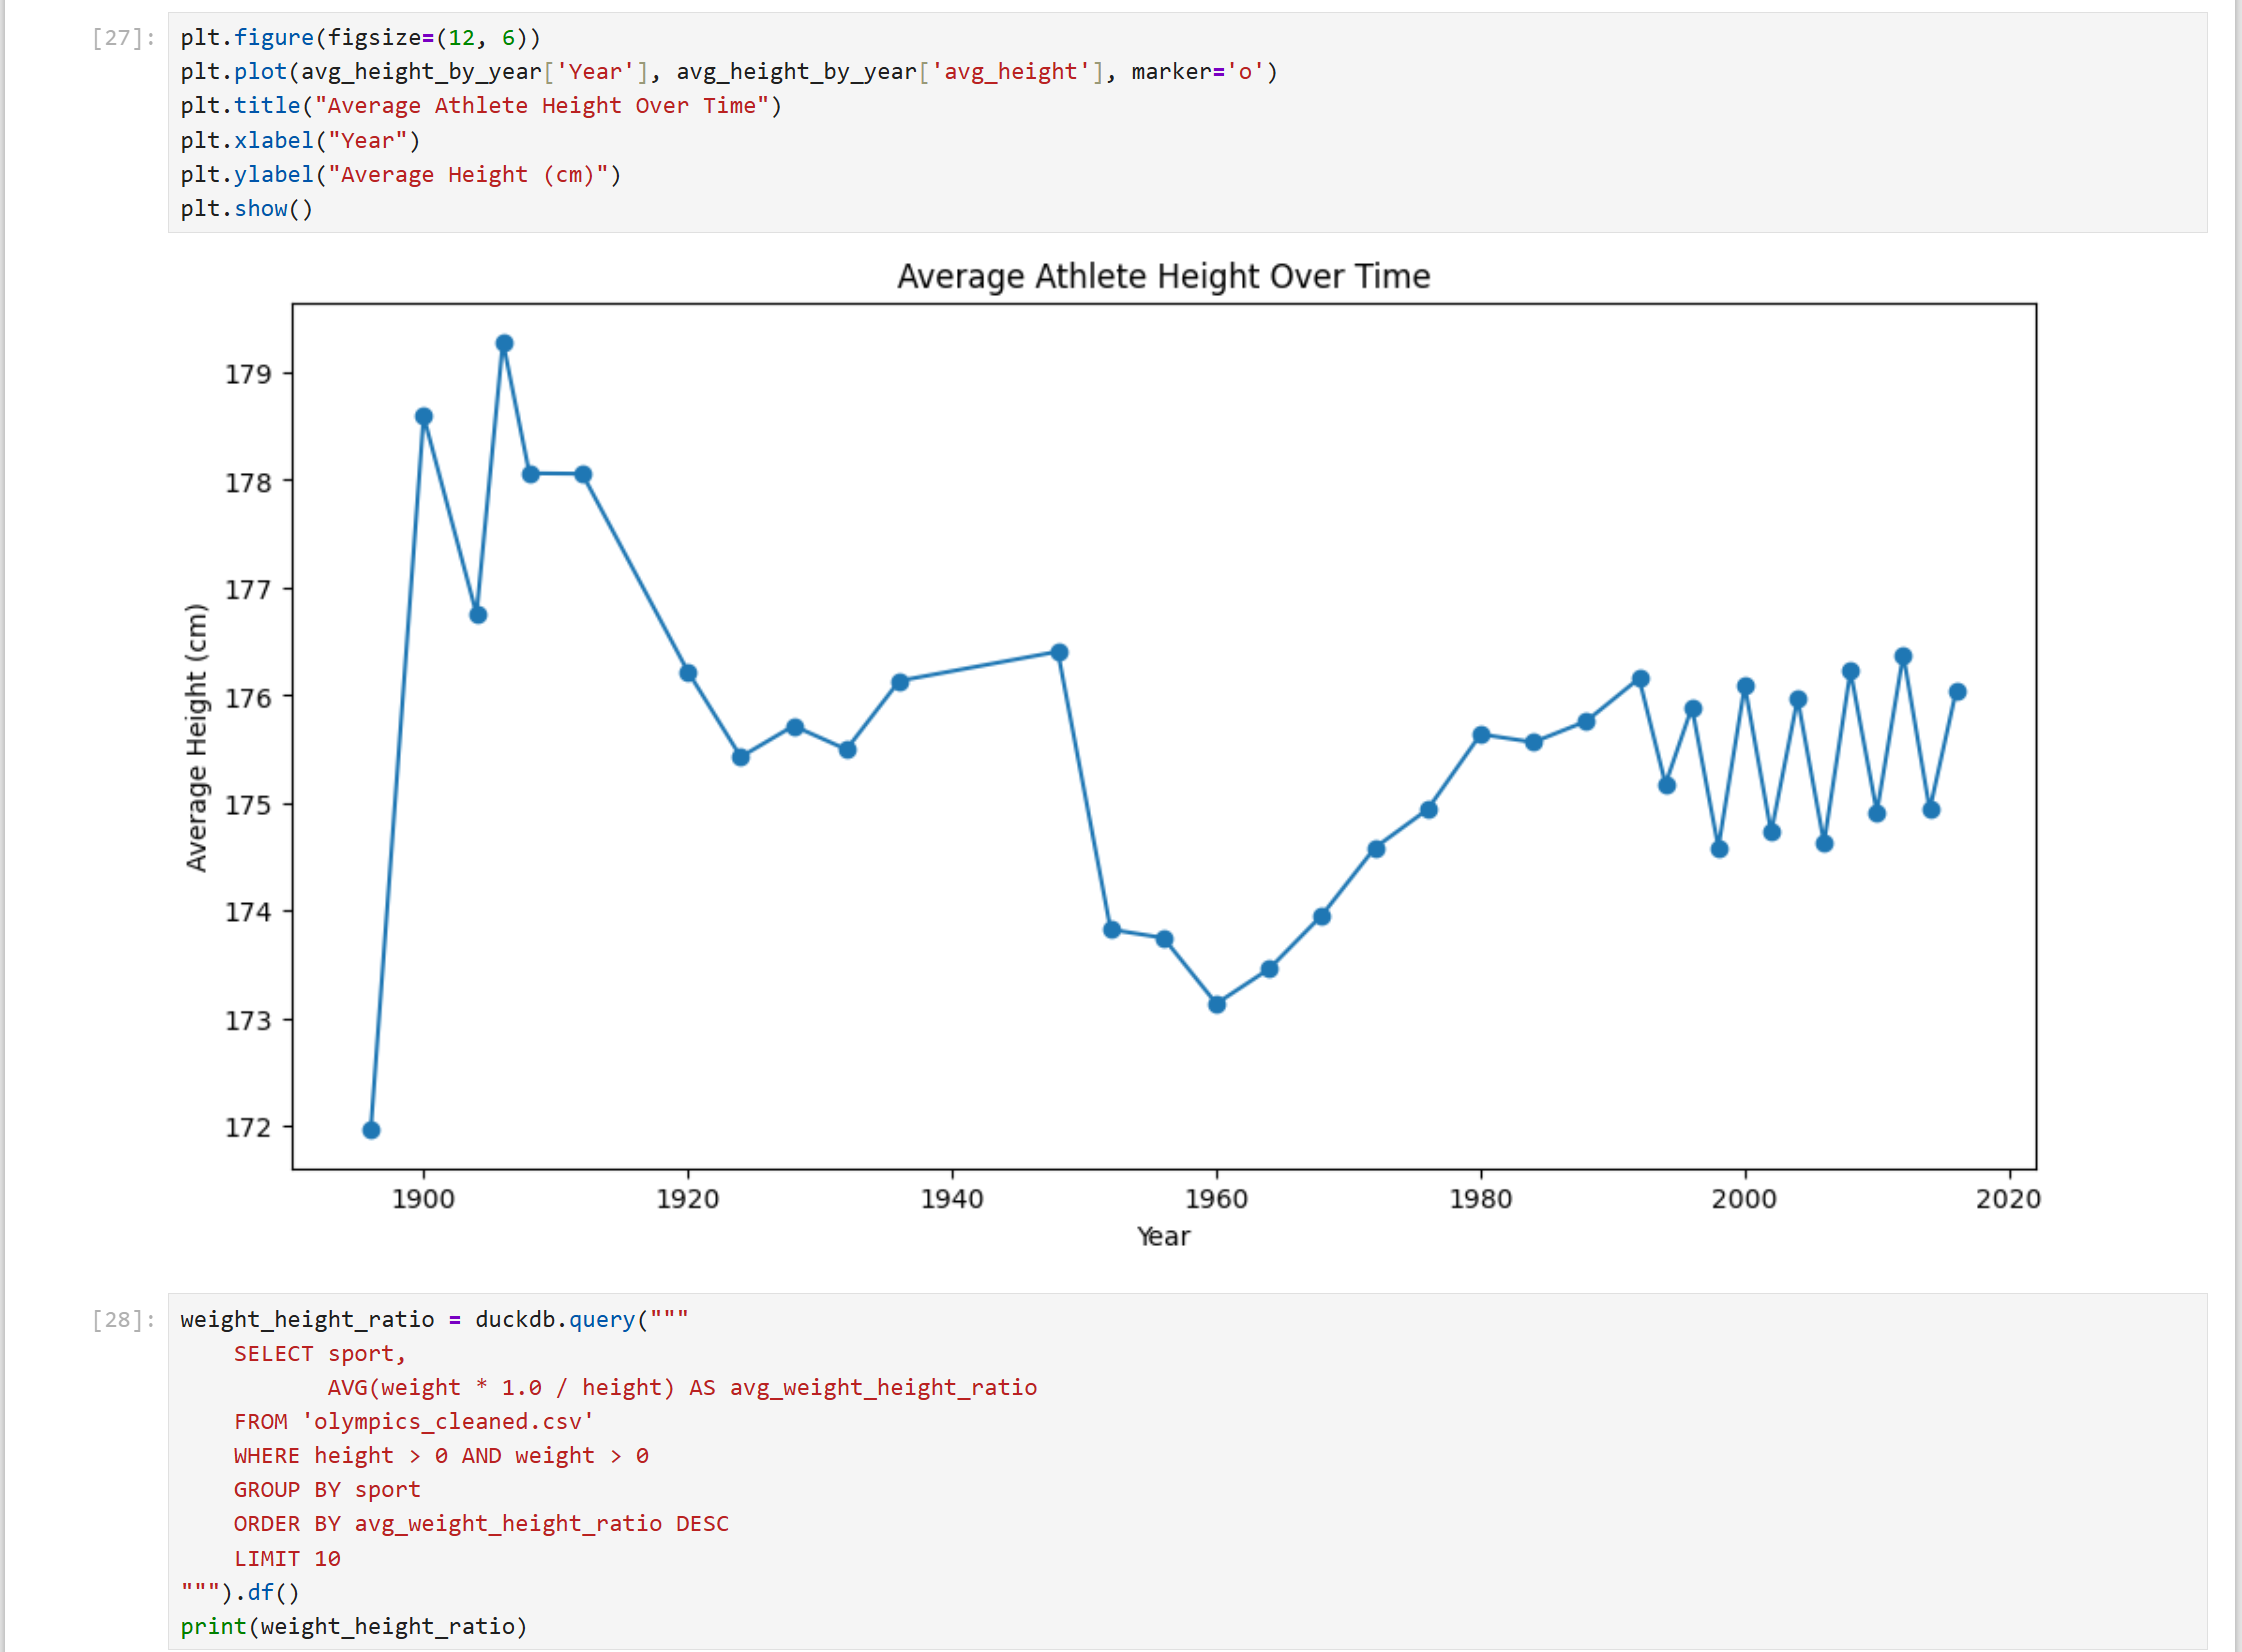
SportsStats Olympic Athletes Analysis
Problem: Olympic history data needed structured analysis to reveal long-term participation and medal trends.
Tools: Python, SQL, Pandas, Matplotlib.
What I did: Cleaned athlete data, ran SQL analyses, and visualized patterns across countries, sports, and demographics.
Key result: The analysis highlighted medal leaders, gender participation shifts, and sport-specific profiles.
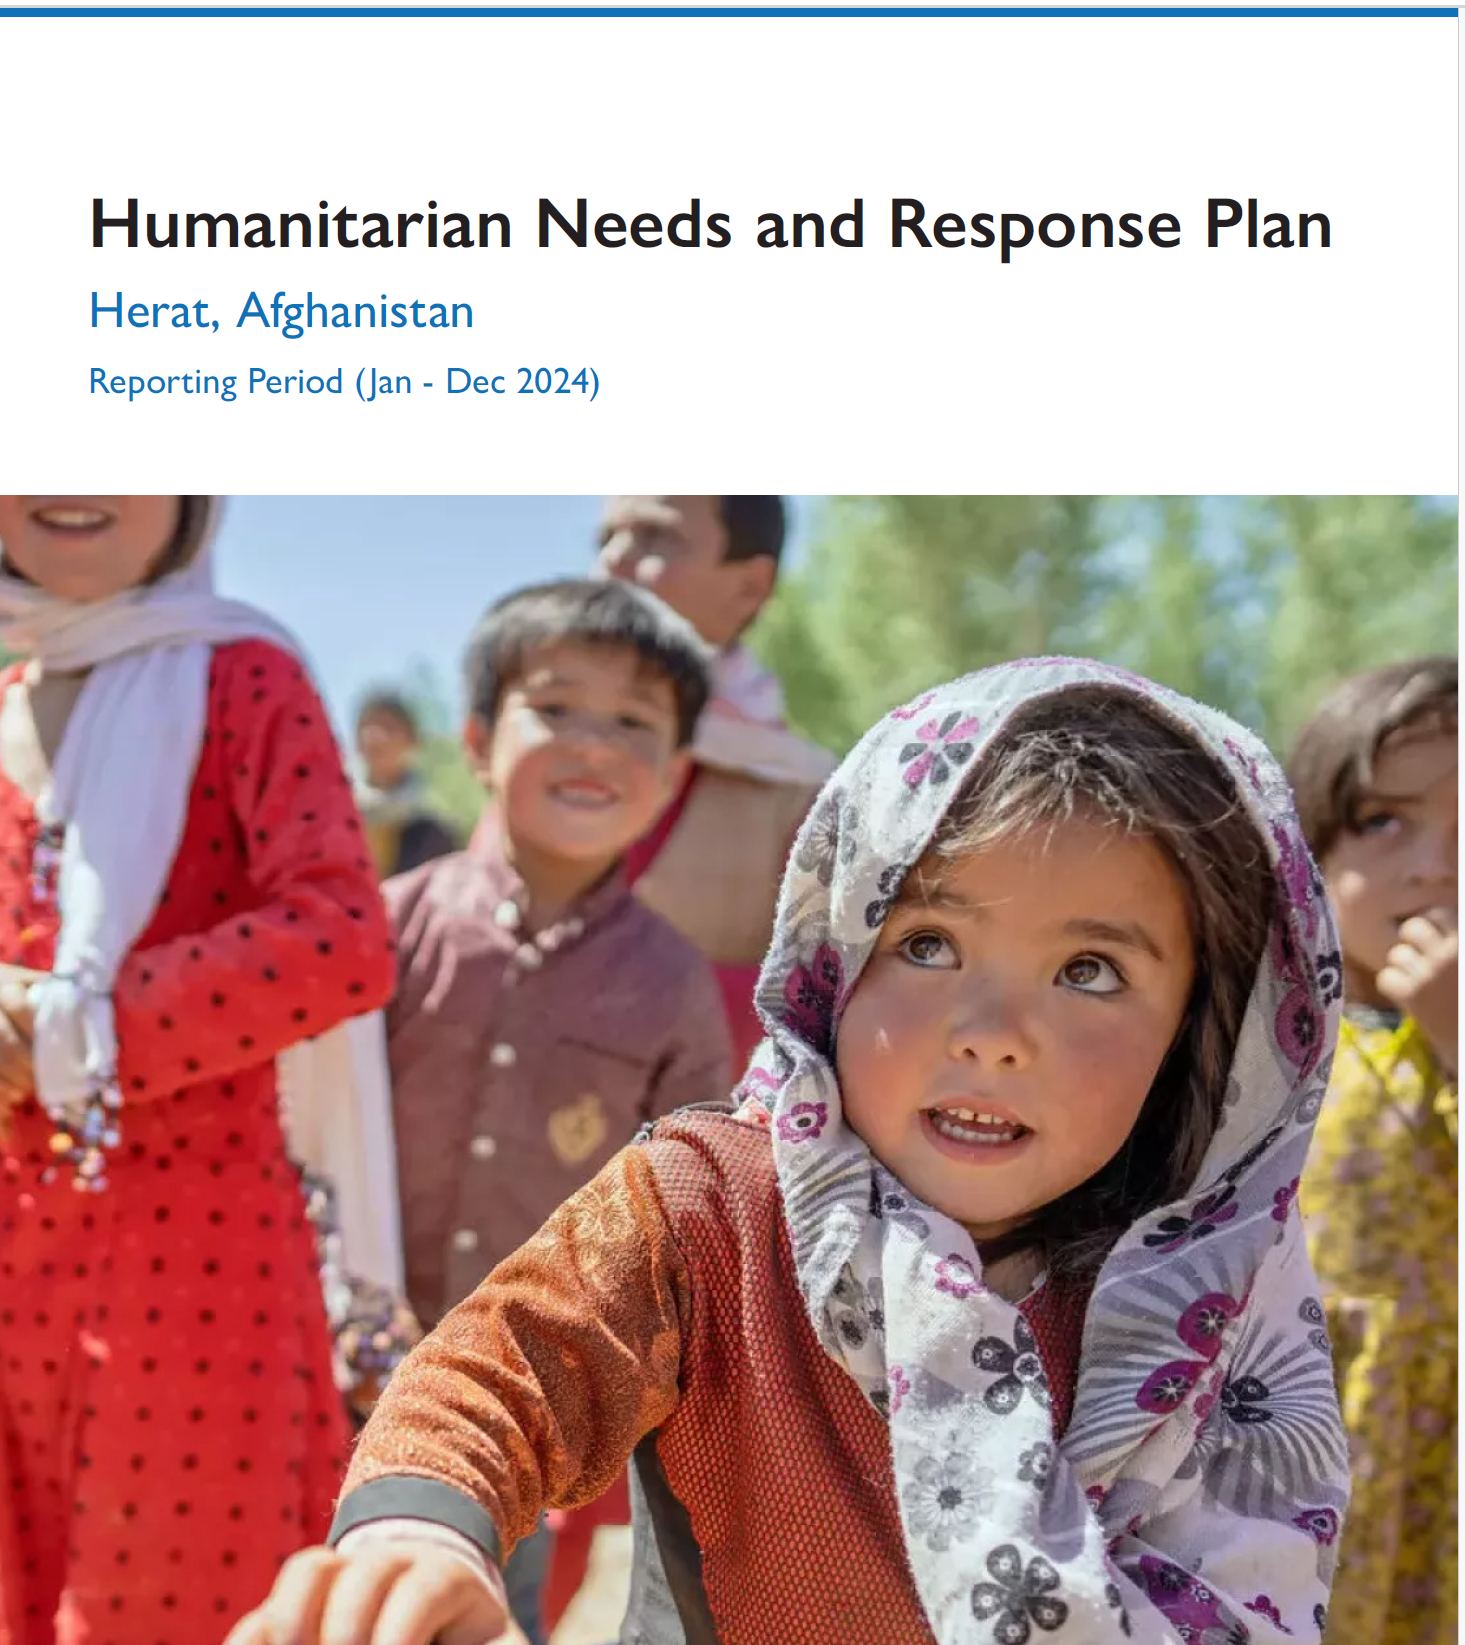
Herat Humanitarian Report Refinement
Problem: A raw humanitarian report was hard to read and not presentation-ready for stakeholders.
Tools: Adobe InDesign.
What I did: Reorganized content, improved hierarchy, and redesigned layout with clearer visual communication.
Key result: The refined report became publication-ready and easier to use for decision-making.